Recently some friends and I competed in M3 Challenge, a fourteen-hour competition where teams of five develop a model that addresses a specific, real-world problem. The first section of this year’s challenge was evaluating the risk of flooding for five national parks: Acadia, Cape Hatteras, Kenai Fjords, Olympic, and Padre Island.
Part of our solution involved running flood simulations on USGS terrain elevation data. Downloading and processing the data (only available in 1×1 degree cells) was actually fairly tricky, so I decided to clean up and generalize some of my code. The result was this MATLAB add-on, which provides a simple interface for downloading, synthesizing, and rendering terrain for anywhere in the United States with 1/3 arc-second resolution. See the GitHub page to browse through the code.
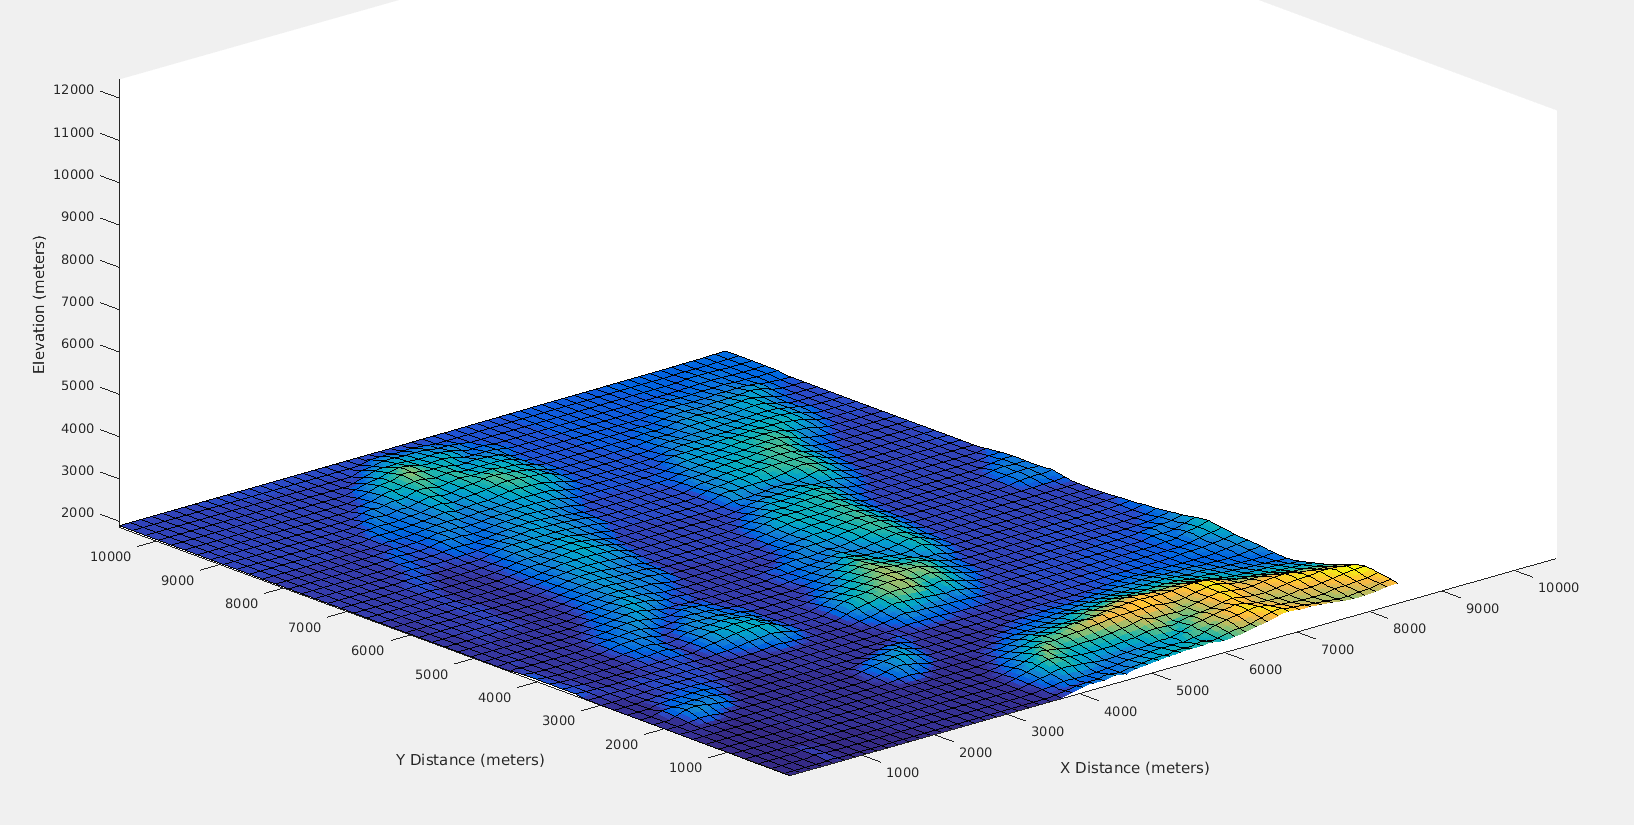
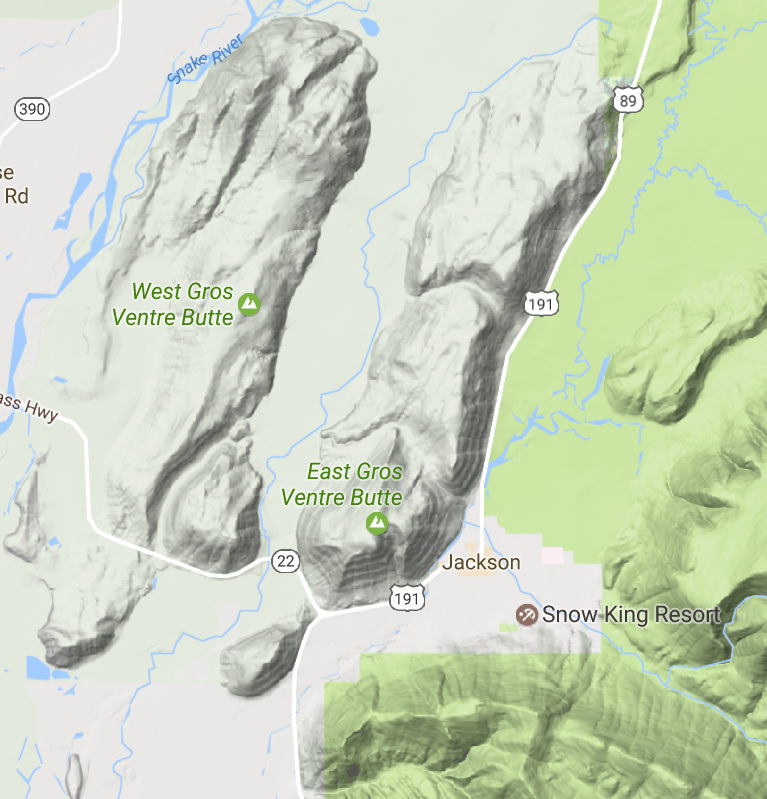
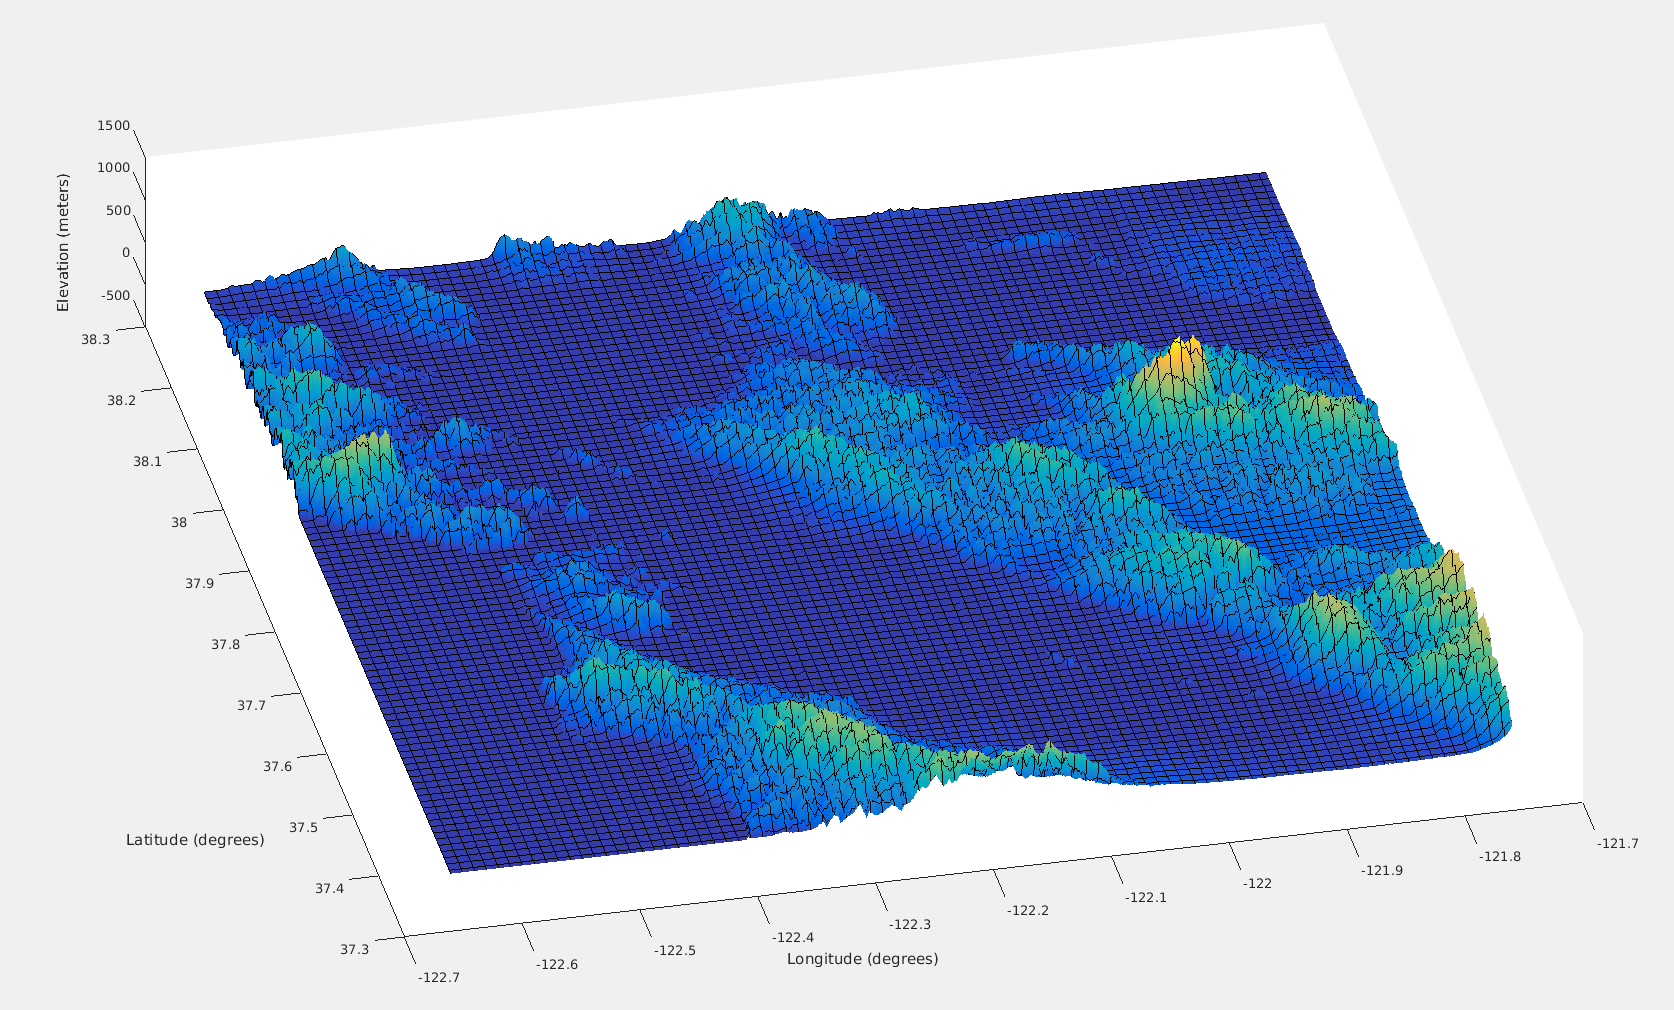
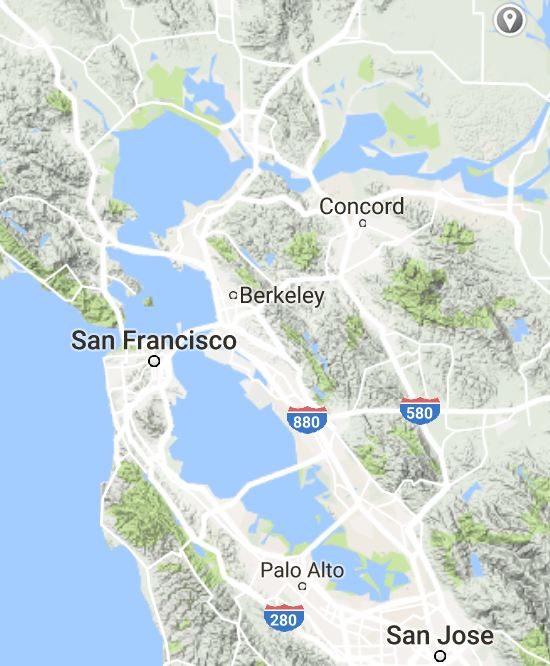
Here are some images comparing the add-on’s output and the corresponding area on Google Maps. For Jackson Hole the X and Y axes are in meters, while for the Bay Area they’re in longitude and latitude (i.e. the Z axis is not proportional).
Jackson Hole, Wyoming
San Francisco Bay Area
Leave a Reply